


")

STOP Guessing: The ONLY 6 Digital Marketing Metrics That Truly Matter in 2026 (and How to Track Them)
In the dynamic landscape of digital marketing, where new platforms emerge daily and algorithms constantly evolve, it’s easy to get lost in a sea of data. Every campaign, every click, every impression generates a metric, leading to an overwhelming amount of information. For over a decade, we have systematically analyzed countless digital marketing campaigns, witnessing firsthand the pitfalls of focusing on vanity metrics and the transformative power of tracking what genuinely contributes to business growth.
By 2026, the imperative to move beyond surface-level insights will be more critical than ever. With increased privacy regulations, the rise of AI in content creation and audience targeting, and an ever-savvier consumer base, a precise, data-driven approach is not just an advantage – it’s a necessity. We believe that true success hinges on understanding a select few, deeply impactful metrics that serve as your North Star, guiding strategic decisions and ensuring sustainable profitability.
This comprehensive guide, born from our extensive experience in navigating complex digital ecosystems, will unveil the six most crucial digital marketing metrics for 2026. We will explain why each metric is indispensable, detail how to accurately track it, and demonstrate how to leverage these insights to stop guessing and start achieving predictable, measurable success. Our aim is to equip you with the knowledge to cut through the noise, optimize your efforts, and build a marketing machine that drives real value.
The Shifting Sands of Digital Marketing Measurement: Why 2026 Demands Precision
The digital marketing world is no stranger to change, but the pace and nature of transformations predicted for 2026 are particularly significant. We are moving further into an era where privacy is paramount, third-party cookies are largely obsolete, and consumers demand authentic, value-driven interactions. These shifts necessitate a re-evaluation of how we measure success.
Traditional metrics like impressions or simple click-through rates, while providing some indication of reach, often fail to tell the full story of impact. They don't inherently reveal profitability, customer loyalty, or the true return on investment (ROI) of your marketing spend. Our collective experience has shown us that businesses that thrive in this environment are those that prioritize metrics directly tied to business outcomes, fostering long-term customer relationships and sustainable growth. This focus allows for more agile adaptation to market changes and a clearer understanding of marketing's contribution to the bottom line.
Metric 1: Customer Lifetime Value (CLTV)
At the core of sustainable growth lies the understanding of your customers' long-term worth. Customer Lifetime Value (CLTV) represents the total revenue a business can reasonably expect from a single customer account throughout their relationship with your company. It's not just about a single purchase; it's about the entire journey.
What is Customer Lifetime Value (CLTV)?
CLTV is a projection of the total revenue that a customer account is expected to generate over its existence. It considers factors like average purchase value, purchase frequency, and customer retention rate. A high CLTV indicates strong customer loyalty and effective post-acquisition strategies, revealing the true value of retaining customers versus constantly acquiring new ones.
Why CLTV Matters in 2026
In a world of increasing customer acquisition costs and fierce competition, focusing solely on new customer acquisition is a losing battle. By 2026, businesses that prioritize customer retention and expansion will dominate. CLTV encourages a long-term view, allowing you to invest more in customer experience, loyalty programs, and personalized marketing efforts that nurture existing relationships. We've seen countless businesses transform their profitability by shifting their focus from one-off sales to fostering enduring customer loyalty, directly impacting their CLTV.
How to Track Customer Lifetime Value (CLTV)
Tracking CLTV involves a few key components:
- Average Purchase Value (APV): Total revenue / Number of purchases.
- Average Purchase Frequency Rate (APFR): Total number of purchases / Total number of unique customers.
- Customer Value (CV): APV x APFR.
- Average Customer Lifespan (ACL): Average number of years a customer remains active.
- CLTV Calculation: Customer Value x Average Customer Lifespan.
While this formula provides a baseline, advanced CLTV models can incorporate gross margin, churn rates, and segmentation. Most modern CRM (Customer Relationship Management) systems and sophisticated analytics platforms can automate CLTV tracking, providing segmented insights into different customer groups.
Metric 2: Customer Acquisition Cost (CAC)
No marketing discussion is complete without understanding the cost associated with bringing a new customer onboard. Customer Acquisition Cost (CAC) is a fundamental metric that, when paired with CLTV, offers a clear picture of marketing efficiency and business sustainability.
What is Customer Acquisition Cost (CAC)?
CAC represents the total cost incurred by a company to acquire a new customer. This includes all expenses related to marketing and sales efforts – advertising spend, salaries of marketing and sales teams, software costs, creative expenses, and more – divided by the number of new customers acquired over a specific period.
Why CAC Matters in 2026
As advertising platforms become more crowded and competitive, and privacy changes make targeting more complex, CAC is on an upward trend for many industries. In 2026, understanding and optimizing CAC will be critical for maintaining healthy profit margins. Businesses that can acquire customers efficiently will have a significant competitive advantage. We systematically analyze CAC for our clients to identify inefficient channels, optimize budget allocation, and ensure that every marketing dollar is working as hard as possible.
How to Track Customer Acquisition Cost (CAC)
The basic formula for CAC is straightforward:
- CAC Calculation: (Total Sales & Marketing Costs) / (Number of New Customers Acquired)
To accurately track CAC, ensure you include all relevant costs:
- Paid advertising (social media, search engines, display networks)
- Content creation and distribution
- Marketing automation software
- CRM software
- Salaries of marketing and sales personnel involved in acquisition
- Agency fees
- Promotional offers and discounts
It’s also crucial to segment CAC by channel, campaign, or even audience segment to identify the most cost-effective acquisition strategies. By meticulously tracking these costs within your accounting software and attributing new customers via your CRM or analytics tools, you gain precise insights.
Metric 3: Marketing Qualified Leads (MQLs) to Sales Qualified Leads (SQLs) Conversion Rate
For businesses with a sales pipeline, the handoff and conversion efficiency between marketing and sales are paramount. This metric measures how effectively marketing efforts translate into genuinely sales-ready opportunities.
What are MQLs and SQLs?
- Marketing Qualified Lead (MQL): A prospect identified by the marketing team as more likely to become a customer compared to other leads, based on their engagement with marketing content or specific demographic criteria (e.g., downloaded a whitepaper, attended a webinar, visited key product pages multiple times).
- Sales Qualified Lead (SQL): An MQL that has been further vetted by the sales team (or through specific lead scoring) and deemed ready for a direct sales engagement. This typically means they fit the ideal customer profile, have a clear need, budget, authority, and timeline (BANT criteria often apply).
Why MQL to SQL Conversion Rate Matters in 2026
In 2026, a tight alignment between marketing and sales is non-negotiable. This conversion rate acts as a critical bridge, indicating the quality of leads marketing is generating and the efficiency with which sales can act on them. A low conversion rate suggests either marketing is attracting the wrong audience, or sales isn't effectively nurturing the leads provided – or both. We've repeatedly observed that improving this handover dramatically boosts revenue without necessarily increasing overall lead volume.
How to Track MQL to SQL Conversion Rate
Tracking this metric requires a robust CRM system and clear definitions for MQL and SQL agreed upon by both marketing and sales teams. The formula is:
- MQL to SQL Conversion Rate: (Number of SQLs / Number of MQLs) x 100
Ensure your CRM or marketing automation platform allows you to tag and track leads as they progress through different stages of your funnel. Regular meetings between marketing and sales teams are essential to refine lead definitions, feedback loops, and optimize the conversion process.
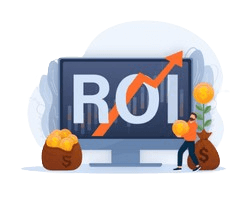
Metric 4: Return on Ad Spend (ROAS)
For any business investing in paid advertising, understanding the direct revenue generated from those investments is paramount. Return on Ad Spend (ROAS) is your go-to metric for evaluating the immediate effectiveness of your ad campaigns.
What is Return on Ad Spend (ROAS)?
ROAS measures the gross revenue generated for every dollar spent on advertising. It's a precise, granular metric that directly links advertising efforts to sales outcomes, allowing for rapid optimization of campaigns.
Why ROAS Matters in 2026
With increasing ad costs and the need for hyper-targeted campaigns, every advertising dollar must count. ROAS provides an immediate, actionable insight into campaign performance, enabling marketers to quickly identify what's working and what isn't. In 2026, where ad platforms are becoming more intelligent and competitive, optimizing for ROAS is critical for maximizing profit from paid channels. We consistently use ROAS to guide budget reallocation, keyword strategy, and creative testing, ensuring our clients achieve optimal profitability from their ad spend.
How to Track Return on Ad Spend (ROAS)
Tracking ROAS is typically done directly within your advertising platforms (e.g., Google Ads, Meta Ads Manager) or through integrated analytics tools. The formula is simple:
- ROAS Calculation: (Revenue from Ad Spend / Cost of Ad Spend) x 100 (often expressed as a ratio, e.g., 4:1)
Most ad platforms automatically calculate ROAS if you have conversion tracking (e.g., purchases, leads) set up and value attributed to those conversions. Ensure your conversion tracking is robust and accurately reflects the revenue generated by specific ad campaigns. Segmenting ROAS by campaign, ad group, keyword, or creative allows for granular optimization.
While often used interchangeably, it's important to distinguish ROAS from ROI:
| Feature | Return on Ad Spend (ROAS) | Return on Investment (ROI) |
|---|---|---|
| Scope | Focuses exclusively on the revenue generated from advertising expenses. | Measures the profitability of an investment relative to its total costs (including product development, operational overhead, etc.). |
| Calculation | (Revenue from Ad Spend / Cost of Ad Spend) | ((Revenue - Total Costs) / Total Costs) |
| Use Case | Optimizing specific ad campaigns, budget allocation within advertising. | Evaluating overall business profitability, strategic investment decisions. |
| Granularity | Highly granular, campaign-level. | Broader, business-level or project-level. |
Metric 5: Organic Search Visibility & Branded vs. Non-Branded Traffic Split
In an age of ever-increasing digital noise, owning your organic presence remains a powerful, long-term asset. This metric goes beyond simple keyword rankings to evaluate your overall prominence in search results and the source of that organic traffic.
What is Organic Search Visibility?
Organic Search Visibility refers to how prominent your website is in organic search engine results for relevant keywords. It's not just about ranking #1 for a single keyword, but about the aggregate visibility across a portfolio of keywords, impression share, and click-through rates (CTR) on those impressions. The split between branded and non-branded traffic then further refines this understanding:
- Branded Traffic: Users searching for your specific company name, product, or recognizable brand terms. This indicates direct brand recognition and loyalty.
- Non-Branded Traffic: Users searching for generic terms related to your industry, products, or services without mentioning your brand. This indicates your ability to capture new audiences and establish authority.
Why Organic Search Visibility Matters in 2026
Organic search is a foundational pillar of digital marketing, offering sustained, cost-effective traffic and building long-term brand equity. As advertising costs rise and trust in paid ads potentially wanes, a strong organic presence becomes increasingly vital. By 2026, Google's algorithms will be even more sophisticated, prioritizing websites that demonstrate expertise, authoritativeness, and trustworthiness (E-E-A-T). We have consistently found that investing in a robust organic search strategy yields exponential returns over time, driving high-intent traffic and establishing enduring brand credibility. Understanding the branded vs. non-branded split helps us gauge brand awareness versus market share capture.
How to Track Organic Search Visibility & Branded vs. Non-Branded Traffic Split
The primary tool for this is Google Search Console. Within GSC, you can:
- Monitor your average position for thousands of keywords.
- Track impressions and clicks for those keywords.
- Analyze the click-through rate (CTR) of your listings.
- Segment your queries by branded terms (containing your brand name) versus non-branded terms to see the split in impressions and clicks.
Supplemental tools like SEMrush, Ahrefs, or Moz can provide competitive insights, track your overall organic visibility score, and help identify keyword opportunities. Google Analytics 4 (GA4) will show you the volume of organic traffic and user behavior on your site from organic sources. By analyzing the growth of non-branded traffic, we can gauge success in reaching new audiences, while branded traffic growth reflects increasing brand awareness and recall.
Metric 6: Customer Engagement Rate (Across Key Channels)
Beyond clicks and conversions, the quality of interaction a customer has with your brand dictates loyalty and future purchases. Customer Engagement Rate, when measured meaningfully, is a critical indicator of brand health and relationship strength.
What is Customer Engagement Rate?
Rather than a single formula, Customer Engagement Rate is a composite metric, varying by channel, that measures the depth and quality of interactions customers have with your content and brand. It moves beyond passive consumption (like views or impressions) to active participation. Examples include:
- Website: Average time on page, pages per session, repeat visits, scroll depth, form completions, blog comments.
- Email Marketing: Open rate, click-through rate (CTR), reply rate, forward rate, unsubscribe rate.
- Social Media: Likes, comments, shares, saves, direct messages, brand mentions, private community participation.
- App/Product: Feature usage, session duration, daily/monthly active users, in-app purchases.
Why Customer Engagement Rate Matters in 2026
In 2026, consumers are empowered and discerning. They seek genuine connection and value from brands. High engagement rates signal that your content resonates, your brand is trusted, and your audience is invested. This leads to increased brand loyalty, reduced churn, and positive word-of-mouth. Moreover, platform algorithms increasingly favor highly engaging content, giving it greater visibility. We've seen that brands prioritizing authentic engagement outperform competitors who merely focus on pushing out content, fostering a loyal community that acts as a powerful marketing channel itself.
How to Track Customer Engagement Rate (Across Key Channels)
Tracking engagement is channel-specific but consolidates to a holistic view:
- Website: Use Google Analytics 4 (GA4) to measure 'Engaged Sessions', 'Engagement Rate', average engagement time, and events (e.g., video plays, downloads).
- Email Marketing: Most email service providers (ESPs) offer detailed analytics on open rates, CTRs, and unsubscribe rates. Track these against industry benchmarks.
- Social Media: Utilize native platform analytics (e.g., Meta Business Suite Insights, LinkedIn Analytics, X Analytics). Calculate engagement rates as (Total Engagements / Total Reach or Followers) x 100.
- CRM/Customer Success Platforms: Track customer interactions, support ticket volume, and participation in loyalty programs to gauge deeper engagement.
The key is to define what 'engagement' truly means for each channel and for your specific business goals. Is it a comment on a post, a share, or a five-minute read on a blog? Aligning these definitions across your team will provide actionable insights.
Implementing a Data-Driven Culture: Beyond the Metrics Themselves
Understanding these six metrics is only the first step. The real power comes from embedding a data-driven culture within your organization. We have guided countless organizations through this transition, and our experience shows that success hinges on more than just the right tools; it requires the right mindset and processes.
- Integrated Analytics Platforms: Invest in robust tools (CRM, marketing automation, advanced analytics like GA4, SEO suites) that can consolidate data and provide a unified view of your customer journey.
- Regular Reporting and Review: Establish a cadence for reviewing these metrics – weekly for campaign-level insights, monthly or quarterly for strategic adjustments. This ensures continuous optimization.
- Cross-Functional Collaboration: Marketing, sales, product development, and customer service teams must align on these core metrics. Understanding how each department impacts CLTV, CAC, or MQL-to-SQL conversion fosters collective responsibility for growth.
- Focus on Actionable Insights: Data for data's sake is useless. Train your teams to identify trends, formulate hypotheses, run experiments, and make data-backed decisions. "Why did our ROAS drop?" is a more valuable question than "What was our ROAS?".
- Continuous Learning and Adaptation: The digital landscape is ever-changing. Your measurement strategy must evolve with it. Stay informed about industry best practices and emerging technologies.
By fostering this environment, you transform raw data into a powerful strategic asset, allowing your business to predict, adapt, and excel.
Conclusion: Your North Star for Digital Marketing Success in 2026
As we approach 2026, the complexity of digital marketing will only intensify. The businesses that thrive will be those that cut through the noise, reject vanity metrics, and focus rigorously on the indicators that truly drive revenue and build sustainable customer relationships. We've presented the six essential digital marketing metrics that, from our extensive experience, truly matter:
- Customer Lifetime Value (CLTV): To understand the long-term worth of your customers.
- Customer Acquisition Cost (CAC): To ensure efficient and profitable growth.
- MQL to SQL Conversion Rate: To align marketing and sales for maximum pipeline efficiency.
- Return on Ad Spend (ROAS): To optimize your paid advertising for direct revenue generation.
- Organic Search Visibility & Branded vs. Non-Branded Traffic Split: To build enduring brand authority and capture market share.
- Customer Engagement Rate (Across Key Channels): To foster deep customer relationships and brand loyalty.
By meticulously tracking, analyzing, and acting upon these six metrics, you empower your marketing strategy with precision, foresight, and a clear path to profitability. Stop guessing. Start measuring what truly moves the needle. Our collective insights confirm that this focused approach is not just a recommendation; it's the blueprint for sustained digital marketing success in 2026 and beyond.